
So first let’s try to understand what is anomaly detection and why it is so important in Industrial automation.
In layman terms – Anomaly detection is any process that finds the outliers of a dataset
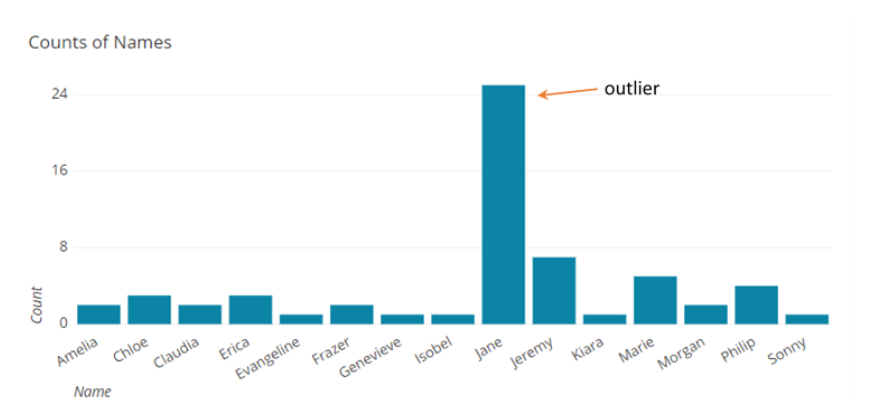
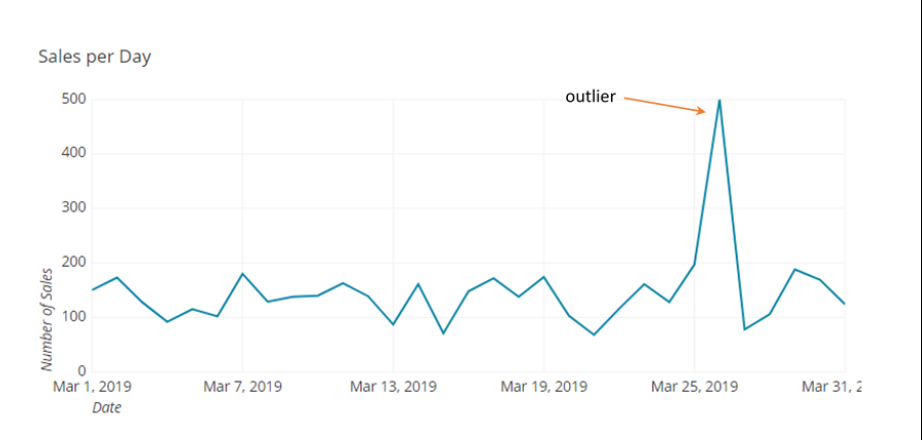
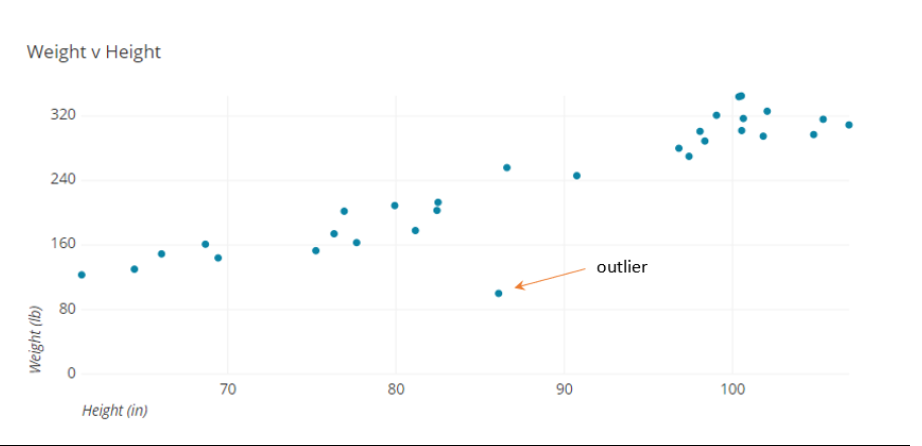
What are outliers ?
An outlier is a value or point that differs substantially from the rest of the data.
They can be easily identified using any chart – [bar graph, trend line, scatter plot etc..]
How can these outliers affect data calculations and analysis ?
I tried to illustrate them with the below basic two examples.
Example1:
you have a dataset1 as following :
{0.5,0.75,0.8,0.6,0.5,0.5,0.5}
The average(mean) of the given dataset1 is = (0.5+0.75+0.8+0.6+0.5+0.5+0.5)/7 = 0.5929
Example2:
you have another dataset2 as following :
{0.5,0.75,0.8,20,0.5,0.5,0.5}
The average(mean) of the given dataset2 is = (0.5+0.75+0.8+20+0.5+0.5+0.5)/7 = 3.3643
If you notice on the above two examples, the difference on the average(mean) value between dataset1 & dateset2 is huge. It is due to the outlier value in dataset2 and this can lead to miscalculations on data aggregation(sum, max, min, std deviation, mean etc..). Here value 20 is outlier or noise or disturbance in the data.
Thank you for reading:)